Line symbols and flow maps
Objectives:
A map of linear features can form two kinds of networks:
Planar graph: where all lines intersect at nodes (stays
flat on the ground).
Examples: highways (mostly - there are underpasses...)
Non-planar graph: lines represent connection between points,
but intermediary crossings are not important. (eg. ocean trade,
air transportation, desire lines)
Line maps
purpose: to identify the network (almost a general map)
Highway maps use hue, pattern (sometimes width classes) to communicate
the attributes of the basic types of highways. (along with reference
items like placenames)
Highway maps can tend toward thematic portrayal by emphasizing
the number of lanes, the speed of the highway, etc.

Limitations on route maps: clutter - symbolism must be
limited to what is feasible
Non-planar graphs:
"lines" can be located freely to communicate a flow
between two endpoints.
Use size (width of line) to portray a continuous attribute (amount
of flow)
(This is a quite distinct measurement framework: the attribute
attaches to a PAIR of objects, not to a single "shape".)

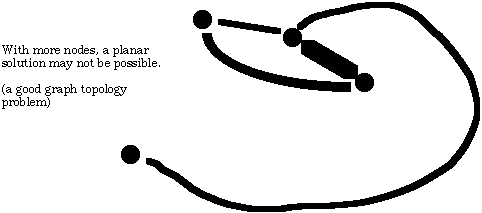
Limitations: the non-planar graph still has to be flattened
onto a plane.
Creates an illusion of a planar structure unless the distribution
works out to be rather simple.
Alternatively, complex interactions are displayed in parts: flow
from Iowa, flow from ..
Version of 6 May 2003