 The
full NWI wetlands raster file, with the same information as a
vector file superimposed. Also shown as a vector file (in red)
is the outer boundary of historic marshlands.
The
full NWI wetlands raster file, with the same information as a
vector file superimposed. Also shown as a vector file (in red)
is the outer boundary of historic marshlands. Some of the more important values of GIS lie not in map storage,
presentation, or telecommunication, but in the use of geo-location
for coincidence tabulation and complex modeling. This Web document
has emphasized individual basic data layers because we assume
that other researchers and planners will want primary building
blocks for their own analyses. However, some results of modeling
efforts and related work are given below by way of example.
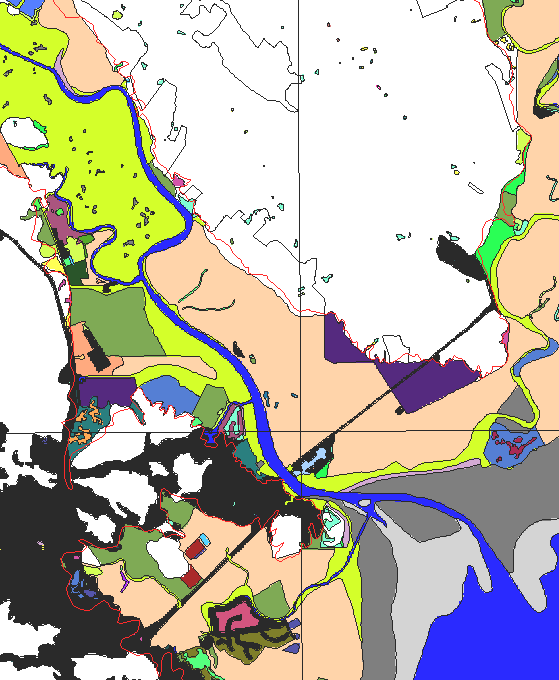
This example shows the mouth of the Petaluma River near the
entrance to San Francisco Bay. The GRASS tool: "Neighbors"
was used to compute the number of different wetland types occuring
within an 81 cell box surrounding a target cell (that is, four,
50x50 meter cells on each side of the target cell).
The
full NWI wetlands raster file, with the same information as a
vector file superimposed. Also shown as a vector file (in red)
is the outer boundary of historic marshlands.
The results of the GRASS Neighbors analysis colors cells with
six different categories observed within the neighborhood - shown
in yellow, five categories (orange), four categories (red), and
three (green); plus the NWI vector file (black) and the historical
line (red). This shows how high-diversity sites are distributed,
and of special interest, indicates that a large proportion of
such sites are located on or near the line of historical wetland
boundary.
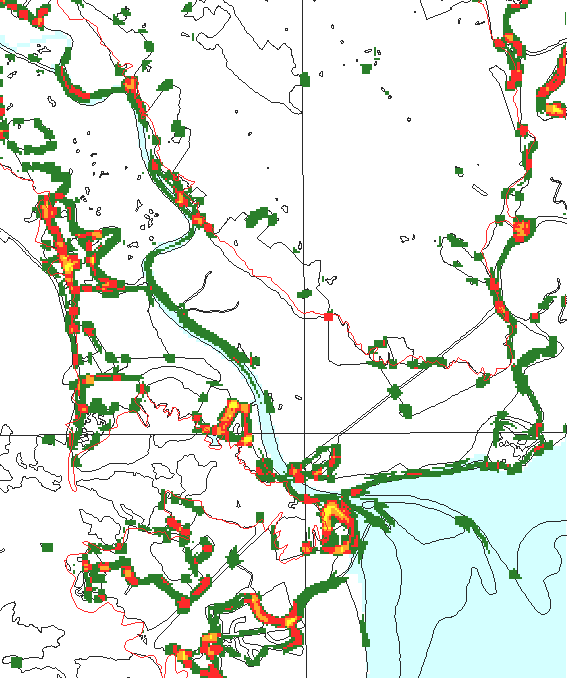
While the level of wetlands complexity is a function of the NWI
classification system itself, the findings are a useful place
to start in looking for high levels of habitat interspersion.
NOT from REGIS
A count of species within a polygon creates another kind
of neighborhood. In a vector system, it is common to aggregate
point events into collection zones. This approach can be done
by some raster packages, too. This is what the MAP II command
SCORE would produce; in Spatial Analyst this is Zonal Statistics...
Some examples: Bat
Diversity in Washington State (count of observations) |