Objectives of lecture
a spatially exhaustive collection zones specify location, shape and size.
an attribute has been assigned to the whole zone
To represent this situation,
the zone (polygon) acts as the symbol;
an area symbol must try to show the value of an attribute
through either color or texture (each subdivided as required)
They may LOOK the same, but the underlying measurement
framework varies collection zones or coverages
Nominal attribute used to generate the boundaries. Display differences between categories...
Nominal data are possible, but not the core method (similar
to coverages).
scale darkness ("value") to the attribute
(could use linear or other scaling of the density function)
Quite hard to read off a specific value...
Most choropleth maps convert continuous attributes to ordinal
classes.
Reasons: Identifiability of the shading patterns (What is the
value of this zone?)
Simplification of the data. (General spatial pattern, not exact
value)
Classification methods are the subject of next
lecture
There are always attempts to cram two variables or more onto
a choropleth presentation. Some are possible, but others confuse
readers.
Any such attempt must use color hue and color value in some combined
manner or some other pair of graphic elements...
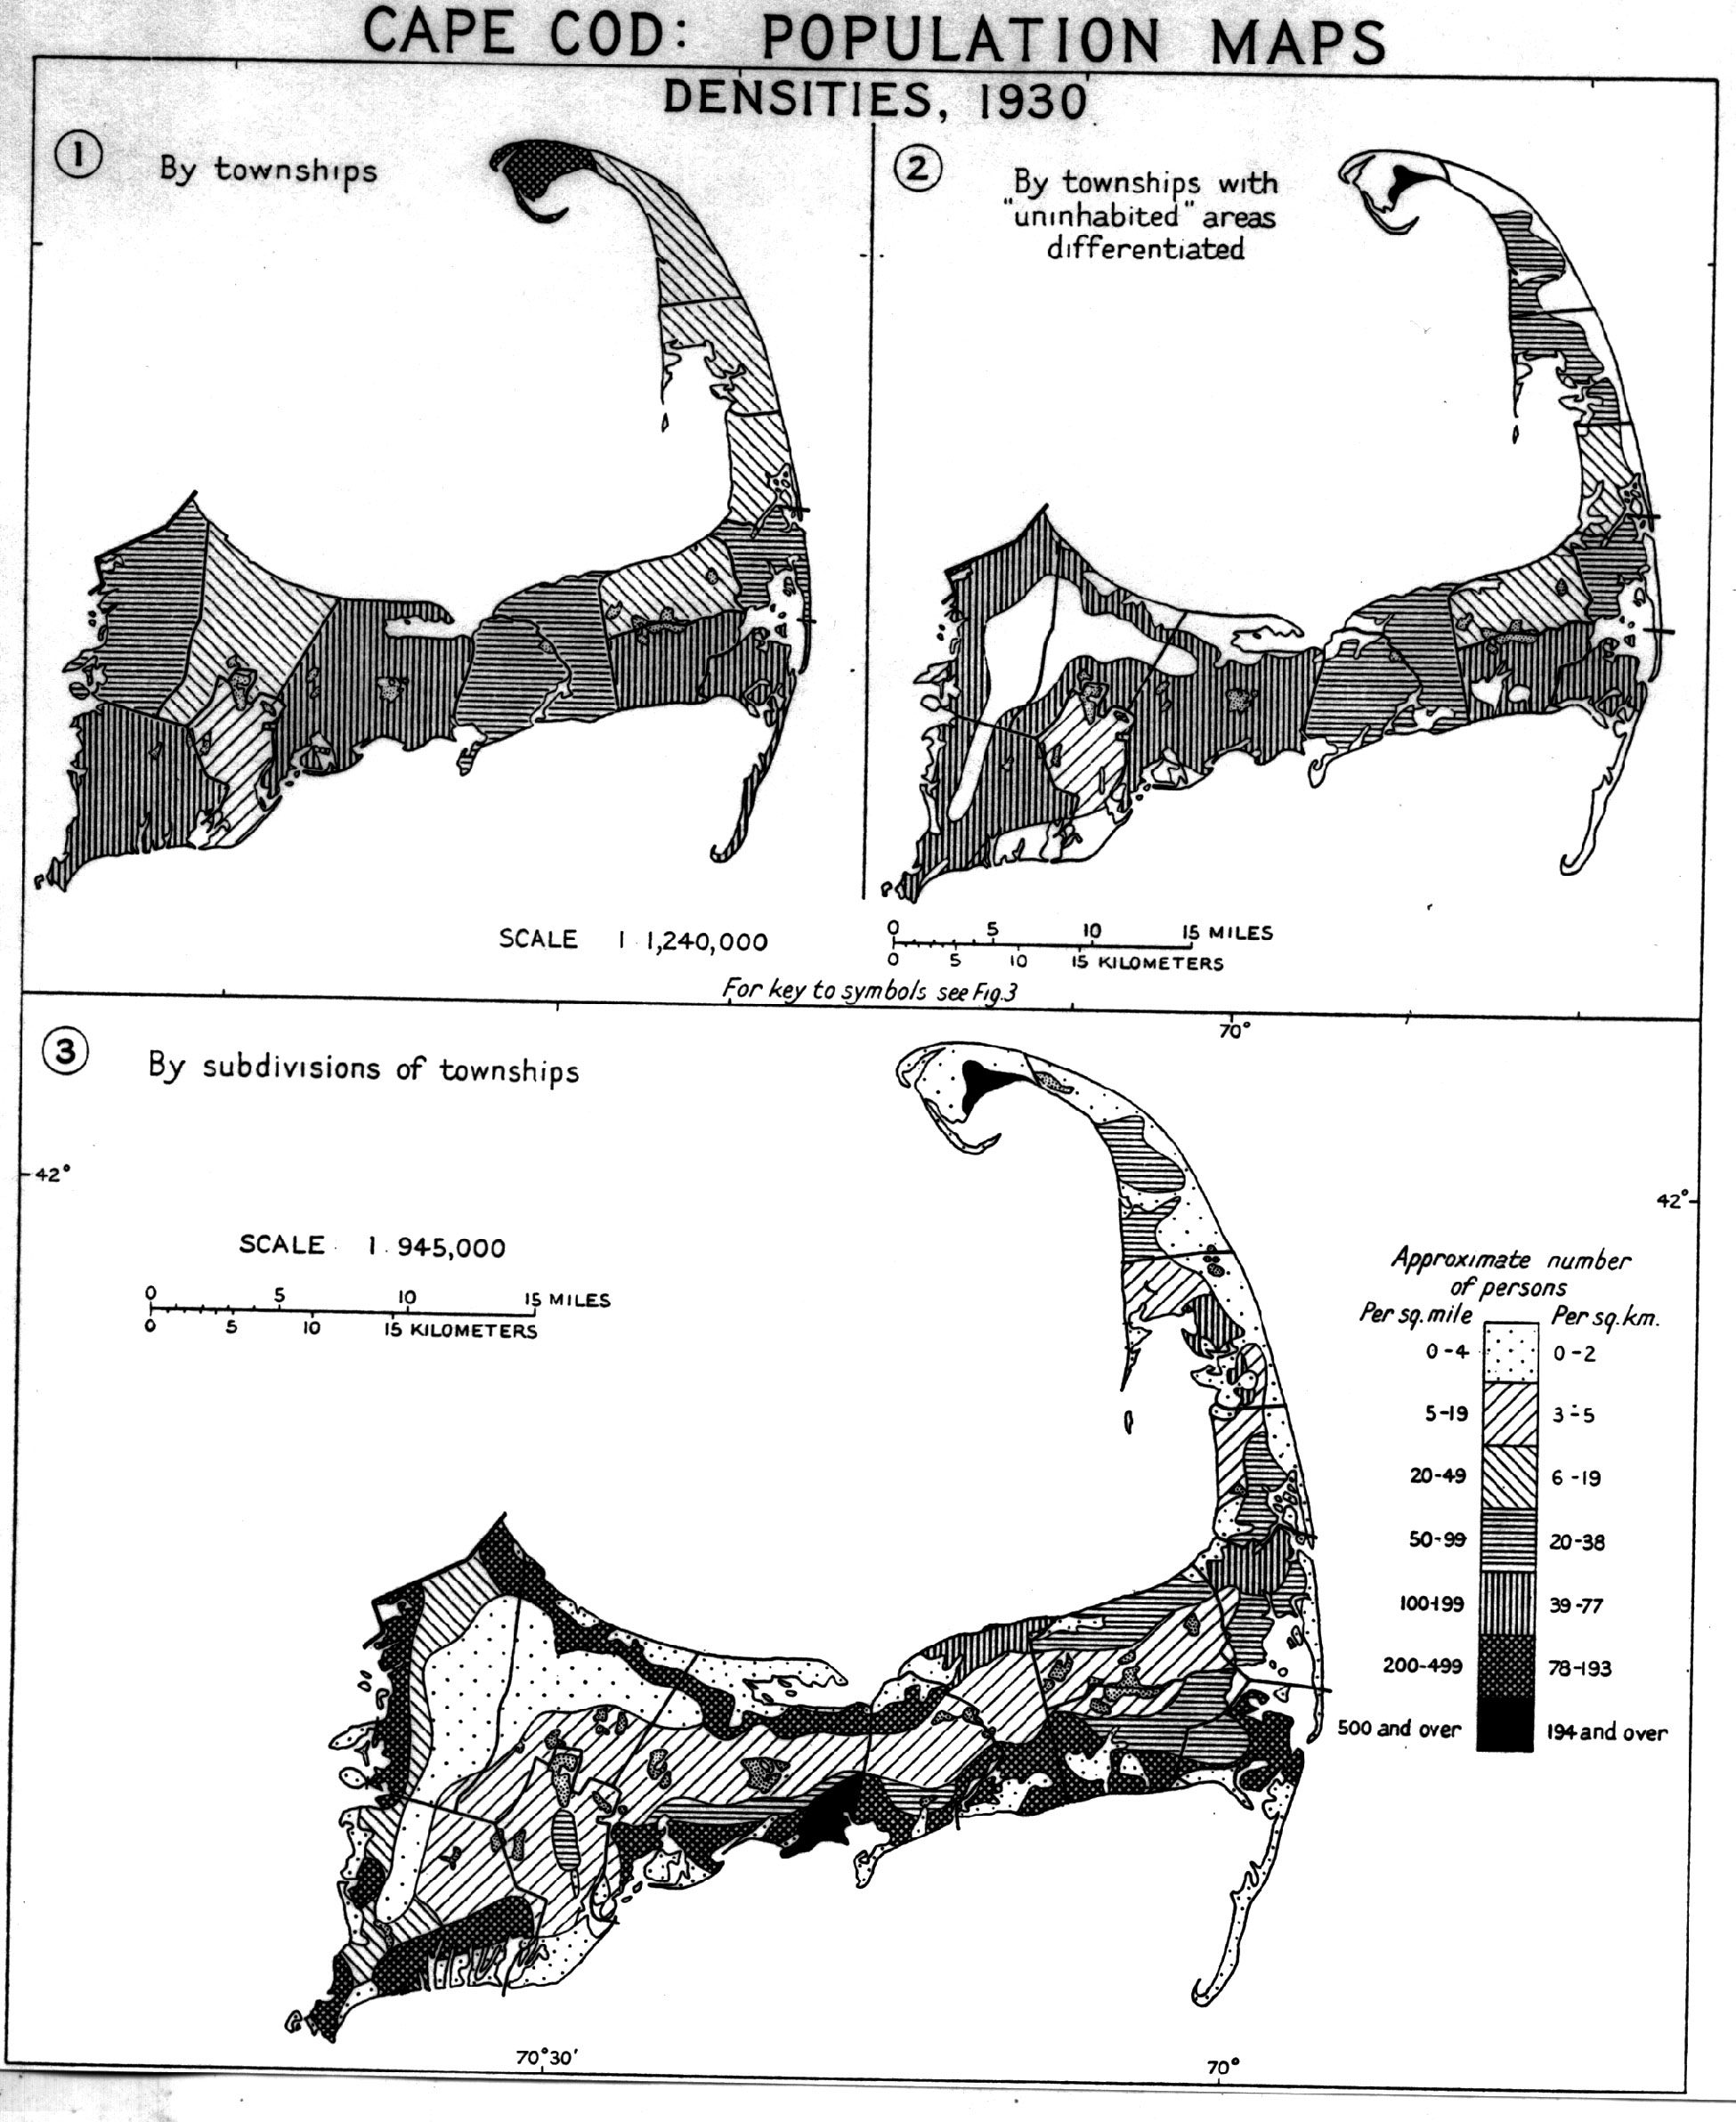
Dent (like most cartographers) presents John
K. Wright's map of Population Density on Cape Cod as if it
were simply a kind of area symbol. It represents a complex TRANSFORMATION
of the original population data
with ANOTHER hidden layer (first uninhabited
land, then land use).